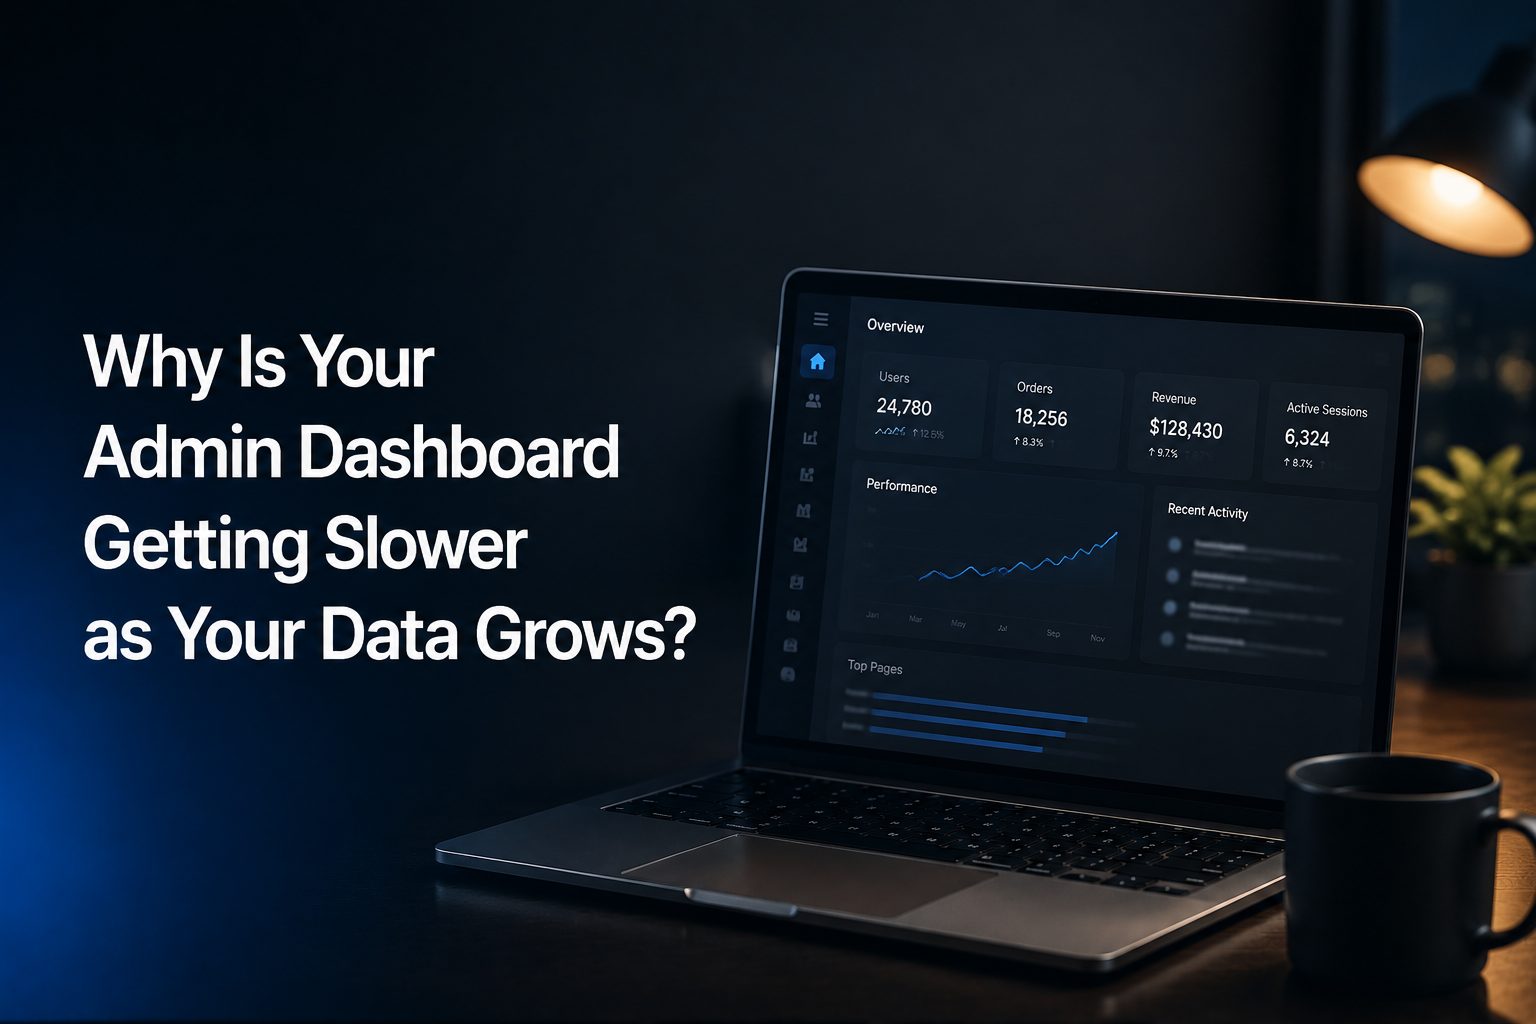
There is a moment most growing companies recognize. The admin dashboard that loaded instantly on launch day now takes eight seconds. Then twelve. A report times out, and someone on the operations team quietly starts pulling numbers into a spreadsheet instead. No bug ticket gets filed, because nothing is technically broken. The system is just slower every quarter, and the slowdown tracks almost perfectly with business success.
That correlation is the point worth paying attention to. A dashboard that degrades as data accumulates is not suffering from a bad week of traffic or an underpowered server. It is reporting something about how the application was built. Architectural decisions made early during custom web application development services usually determine how far a platform can grow before performance becomes a board-level conversation.
Slow Dashboards Are an Architecture Signal, Not a Hardware Problem
The instinctive response is to buy more infrastructure. Larger database instance, more memory, faster disks. This works briefly, which is what makes it dangerous. Throwing hardware at a query that scans an entire table buys you maybe six months, and it buys those months at a permanently higher monthly cost.
The underlying issue is usually that response time is tied to total records stored rather than records actually displayed. A screen showing fifty rows should not care whether the table holds fifty thousand records or fifty million. When it does care, the read path was never designed for growth. That distinction separates applications that scale from ones that need to be rebuilt, and it is why serious custom software development services start with data modeling rather than screen design.
NewAgeSysIT is a New Jersey based software company working primarily with enterprise clients across the United States. Much of the modernization work our teams take on begins the same way, with a platform that functions correctly but has quietly become slower every quarter as the business succeeded.
What Defines an Enterprise-Grade Application
Enterprise-grade is an overused phrase. In practice it describes five measurable properties, all of which show up in dashboard performance.
Scalability. Query cost stays flat as stored volume rises. This is achieved through indexing strategy, pagination that does not rely on offsets, and pre-computed aggregates rather than live calculation.
Performance. The team defines an explicit budget for each view, measured at the ninety-fifth percentile rather than the average. Averages hide the experience of your heaviest users, who are often your most valuable accounts.
Reliability. Analytical reads do not compete with transactional writes. When a finance manager runs a twelve-month report, order processing should not slow down.
Security. Access control is enforced at the data layer without forcing full-table scans, and every administrative action is logged in a way that supports audit requirements.
Integration. Dashboards typically pull from a CRM, a payment processor, a warehouse system, and internal tables. Whether that consolidation happens efficiently or through dozens of sequential API calls at render time is a design decision with permanent performance consequences.
Key Pillars for Long-Term Growth
Modular Architecture
The microservices versus monolith debate is often framed incorrectly. A well-structured monolith outperforms a poorly decomposed set of services for most mid-market companies. What matters is separation of concerns, specifically separating the read path that serves reporting from the write path that handles transactions.
Once reporting has its own optimized data store, dashboards can be tuned aggressively without any risk to core operations.
Cloud-Native Development
Read replicas, managed analytical databases, and elastic compute solve real problems. They do not solve inefficient queries. Cloud infrastructure amplifies whatever architecture you already have, including the inefficient parts, and it bills you monthly for the privilege.
The correct sequence is to fix the data access patterns first, then use cloud elasticity to handle genuine demand variability.
Data-Driven Decision Making
Most dashboards recalculate the same aggregates on every page load. Revenue by region, orders by status, and month-over-month comparisons rarely need to be accurate to the second.
Materialized views, scheduled rollup tables, and time-based partitioning turn expensive live calculations into cheap lookups. Add a retention policy so operational tables are not carrying six years of history that nobody queries.
Automation and AI Readiness
Every organization now wants forecasting, anomaly detection, or natural language querying layered onto their reporting. These capabilities depend entirely on clean, well-structured, accessible data. A platform that cannot serve a filtered report in under two seconds is not ready for anything more ambitious.
Common Mistakes Businesses Make
Building for launch-day volume. Development teams test against a few thousand seeded records. Everything performs beautifully. Nobody models what happens at two million rows, and the problem surfaces eighteen months later when the cost of change has multiplied.
Treating scalability as a later phase. Indexing strategy, pagination approach, and archival policy are inexpensive to establish upfront and disruptive to retrofit. Deferring them is not a cost saving. It is deferred debt with interest.
Selecting the stack for the wrong reasons. Technology chosen for hiring convenience or team familiarity, rather than workload characteristics, creates a mismatch that compounds. A common example is running heavy analytical queries against a transactional database because it was already there.
Best Practices for Building Future-Ready Applications
Plan Around Data Growth, Not Just Features
Before development begins, project data volume across a three to five year horizon. Which tables grow fastest, how much history must stay immediately queryable, and what can be archived. These answers shape the architecture more than any feature list.
Choose a Development Partner Who Asks About Scale
The right partner asks how many records you expect in three years, how your team actually uses reports, and what your acceptable response time is. Vendors who move straight to interface mockups without asking these questions will build something attractive that ages badly.
Engagements at NewAgeSysIT typically open with a data and performance assessment before any build work is scoped, because rebuilding a platform is considerably more expensive than architecting it correctly the first time.
Treat Optimization as Continuous
Instrument slow queries in production and review them on a schedule. Set performance budgets and enforce them in your deployment pipeline so regressions are caught before release rather than reported by frustrated users.
A Practical Example
A mid-sized distribution company operating across several states had an order management dashboard that took roughly fourteen seconds to load. Their operations team had stopped using it, relying on daily exported spreadsheets instead, which meant decisions were being made on stale data.
The diagnosis was not exotic. The main view ran an unindexed count across every historical order, then issued a separate query for each row to fetch customer details. It worked fine at forty thousand orders. At three million, it collapsed.
The remediation involved moving historical records to a partitioned archive, adding a nightly rollup table for aggregate metrics, replacing the row-by-row lookups with a single joined query, and routing all reporting traffic to a read replica. Load time settled under one second.
The measurable outcome was not the performance number. It was that the operations team returned to the live system, which restored real-time visibility into inventory and shortened their reorder cycle.
Conclusion
A dashboard that slows as data grows is useful information. It tells you the application was built for the company you were, not the company you are becoming.
The organizations that handle this well treat scalability as an ongoing architectural discipline rather than an emergency response. They plan around data growth, separate reporting from transactions, and measure performance continuously.
The alternative is a platform that quietly becomes harder to use every quarter until someone finally proposes replacing it. That decision is always more expensive than the design work that would have prevented it.